


Show Me the Data: Data and Maps is now refreshed Daily
Thursday, July 9, 2009 Data and Maps is the Clean Air Market Division's (CAMD) publicly-accessible Web site for presenting emissions trading data. One of the types of data on the Web site is the emissions data which are submitted during each reporting period.
In the past, when data were submitted as EDRs, the emissions data for a quarter were moved over to Data and Maps approximately twenty days after the reporting period ended. Now, as part of the re-engineering work, the emissions data which are submitted as XML are being refreshed on a daily basis. That means that emission data which are submitted today are available to be viewed in Data and Maps tomorrow. (The data are actually loaded into Data and Maps around 4:00 a.m. ET. At that time, all emissions data are loaded into Data and Maps for all emissions data which have been submitted through ECMPS to the EPA Host System and have not already been moved to Data and Maps.) Note, the data are loaded as preliminary data. The data will remain preliminary until the data are finalized after compliance.
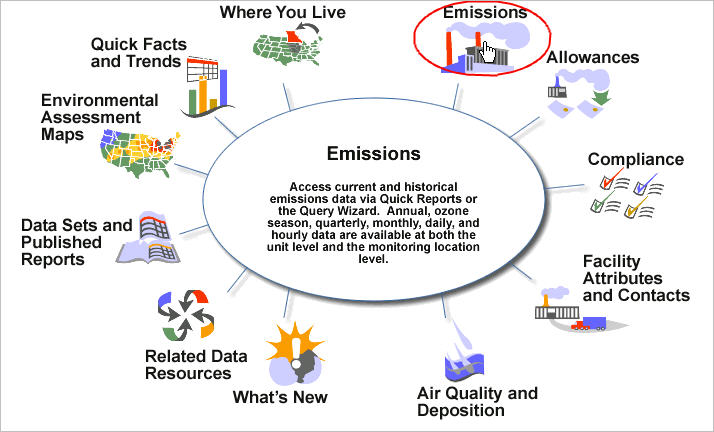
1. On the Data and Maps Web site, the data can be viewed by clicking on the Emissions image.
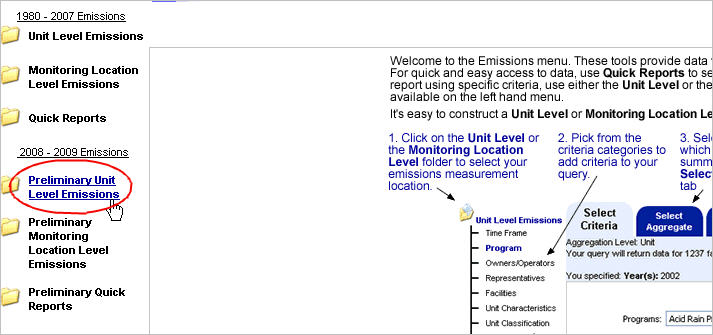
2. On the Emissions page, select the "Preliminary Unit Level Emissions" folder.
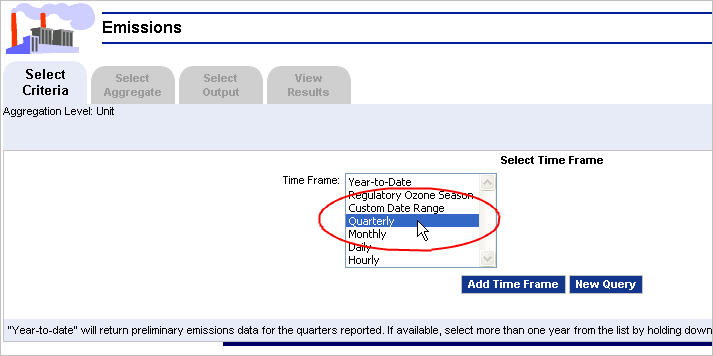
3. Select the "Quarterly" time frame.
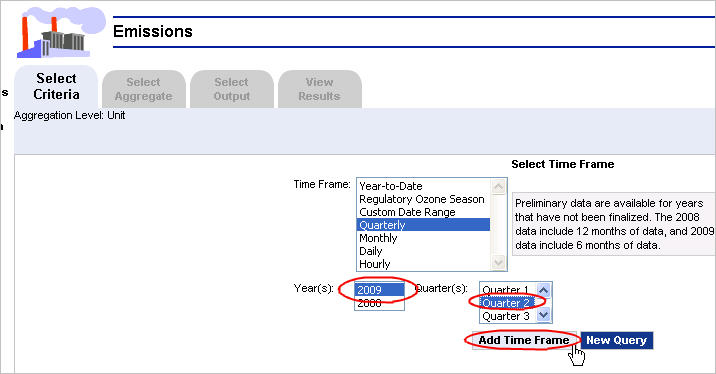
4. Complete the Time Frame selection by selecting "2009" as the year and "Quarter 2" as the quarter and clicking the "Add Time Frame" button.
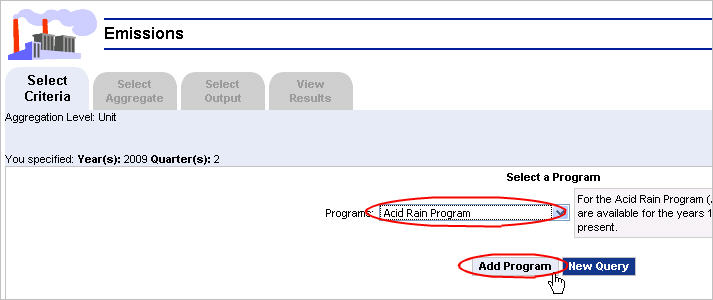
5. Select a program from the list and click the "Add Program" button. In this example, the "Acid Rain Program" is selected.
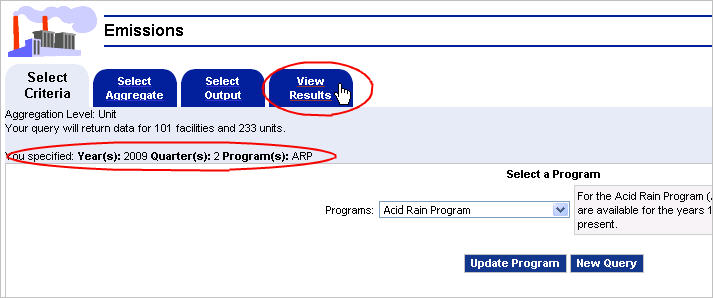
6. Note that your criteria are displayed below the tabs. Click on the "View Results" tab to query the database and return the results.
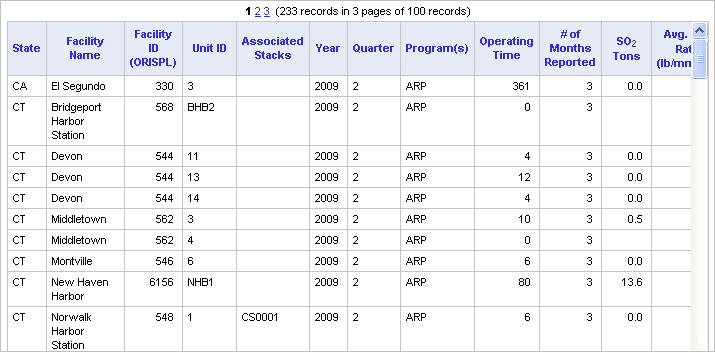
7. The results of the query are displayed in a table format on the Web page.
Questions about Data and Maps should be directed to Data and Maps Technical Support.
Labels: Data and Maps
Posted at
7:30 AM
2 Comments
![]()
![]()